

How to Track PG Occupancy Effectively and Reduce Vacant Beds
Every empty bed is lost revenue. Here is how successful PG operators track bed-level occupancy, spot vacancies early, and fill beds faster.
Updated
The cost of empty beds
A PG with 100 beds at ₹8,000 per bed earns ₹8,00,000/month at full occupancy. Ten vacant beds — just 10% — cost ₹80,000 every month. That is ₹9,60,000 per year in lost revenue, before you count the marketing effort to fill those beds again.
Every vacant bed in a PG costs money. Whether you run a 20-bed property or manage multiple buildings with hundreds of tenants, occupancy directly drives profitability — more than almost any other operational metric.
Most PG owners know how many rooms they have. Far fewer know their actual occupancy status at any given moment.
Questions like these should take seconds to answer — but for many owners, they take phone calls, spreadsheet checks, or a walk through the property:
- Which beds are vacant right now?
- Which tenants are moving out next month?
- Which rooms are partially occupied?
- What is my occupancy percentage this week?
When answers are slow, decisions are delayed. Vacancy periods stretch longer. Revenue leaks quietly — one empty bed at a time.
This guide explains how successful PG operators track occupancy and reduce vacant beds — without adding more manual work to an already packed schedule.
Why occupancy matters more than most owners realise
Many owners focus heavily on rent collection. That is important — but occupancy determines whether there is rent to collect in the first place.
Consider a PG with 100 beds and an average rent of ₹8,000 per bed:
| Occupancy | Occupied beds | Monthly revenue | Annual revenue |
|---|---|---|---|
| 100% | 100 | ₹8,00,000 | ₹96,00,000 |
| 95% | 95 | ₹7,60,000 | ₹91,20,000 |
| 90% | 90 | ₹7,20,000 | ₹86,40,000 |
| 85% | 85 | ₹6,80,000 | ₹81,60,000 |
Small gaps, big numbers
At 90% occupancy, ten vacant beds cost ₹80,000 per month — ₹9,60,000 per year. Improving occupancy from 90% to 95% adds ₹40,000 every month without adding a single bed to the property. That is why operators who track occupancy weekly outperform those who only check at month-end.
Common occupancy tracking mistakes
Tracking rooms instead of beds
This is one of the biggest mistakes in shared accommodations. A room may have two, three, or four beds. If one tenant leaves a four-sharing room, the room is not vacant — one bed is vacant.
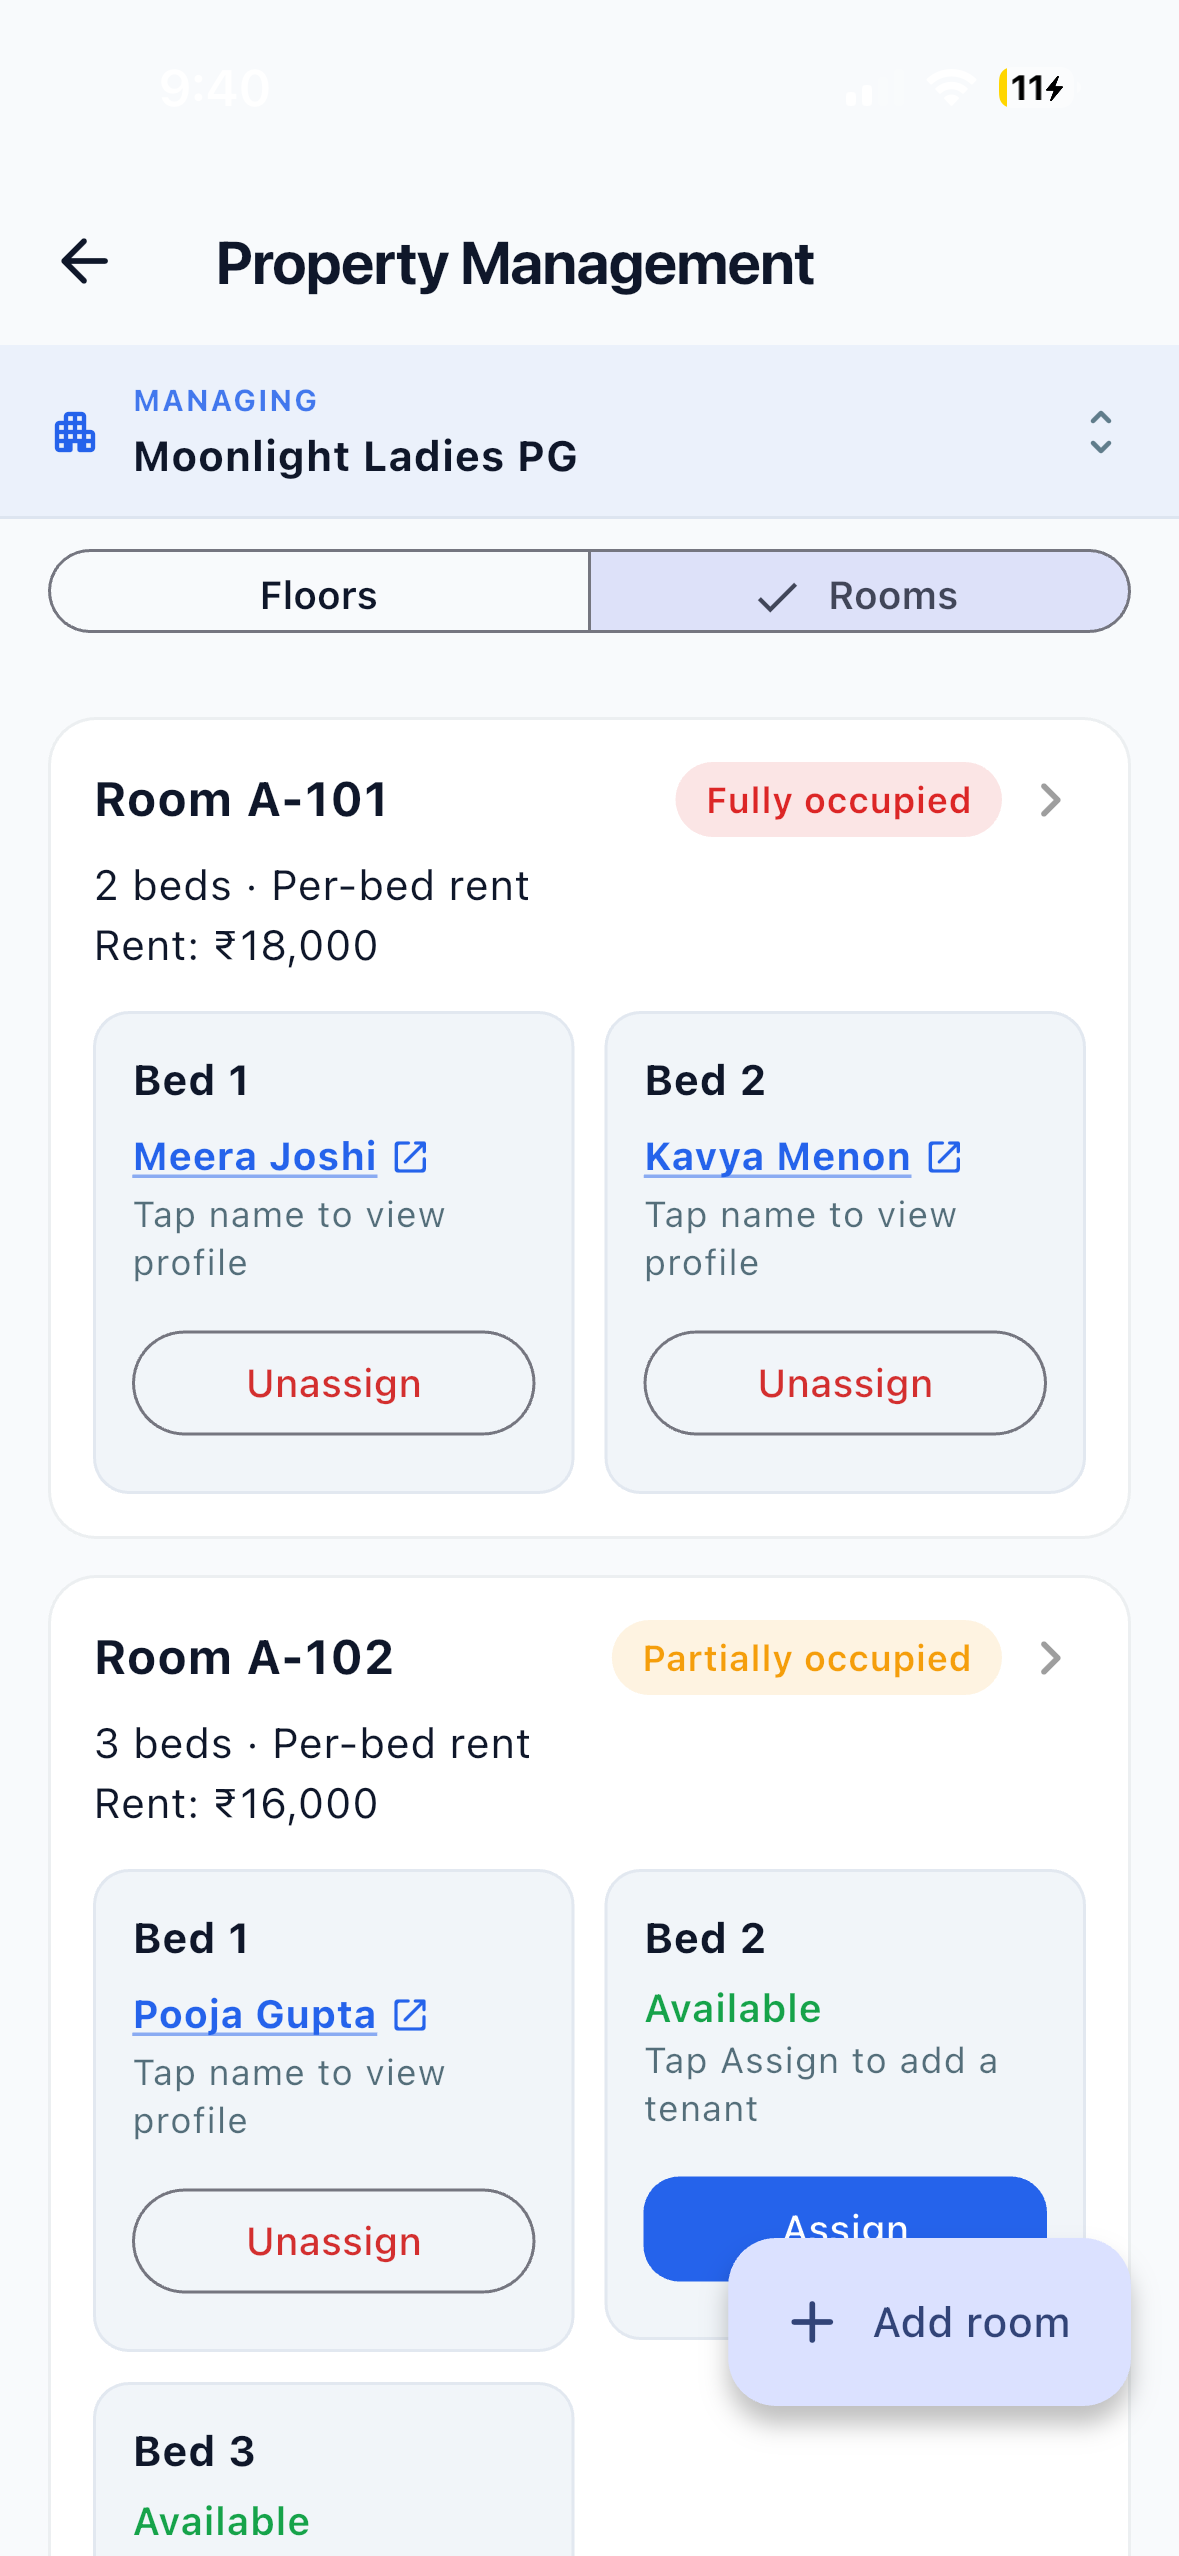
Owners who track only room numbers lose visibility into available inventory. Walk-in prospects ask for a bed; the owner says “no vacancy” because the room has three tenants — missing the one open bed that could have been filled today.
Better approach
Track occupancy at three levels: floor → room → bed. A four-sharing room with three active tenants is 75% occupied at the bed level, even though the room itself is not empty.
Not recording upcoming move-outs
Most vacancies do not happen overnight. Tenants often inform staff weeks in advance — but that date ends up in a WhatsApp message, a phone call, or a warden’s notebook.
When move-out dates are not tracked centrally, marketing starts too late. The tenant leaves. The bed sits empty for two weeks while you scramble to find a replacement. That gap is pure lost revenue.
Relying on memory
In a 15-bed PG, the owner often knows every tenant by name and every vacancy by heart. At 60 beds across two properties, that breaks down. “How many beds are available next month?” should never depend on someone’s memory — but for many PGs, it still does.
If this sounds familiar, see our guide on 5 signs your PG has outgrown WhatsApp — occupancy confusion is often the first sign.
The occupancy metrics every PG owner should track
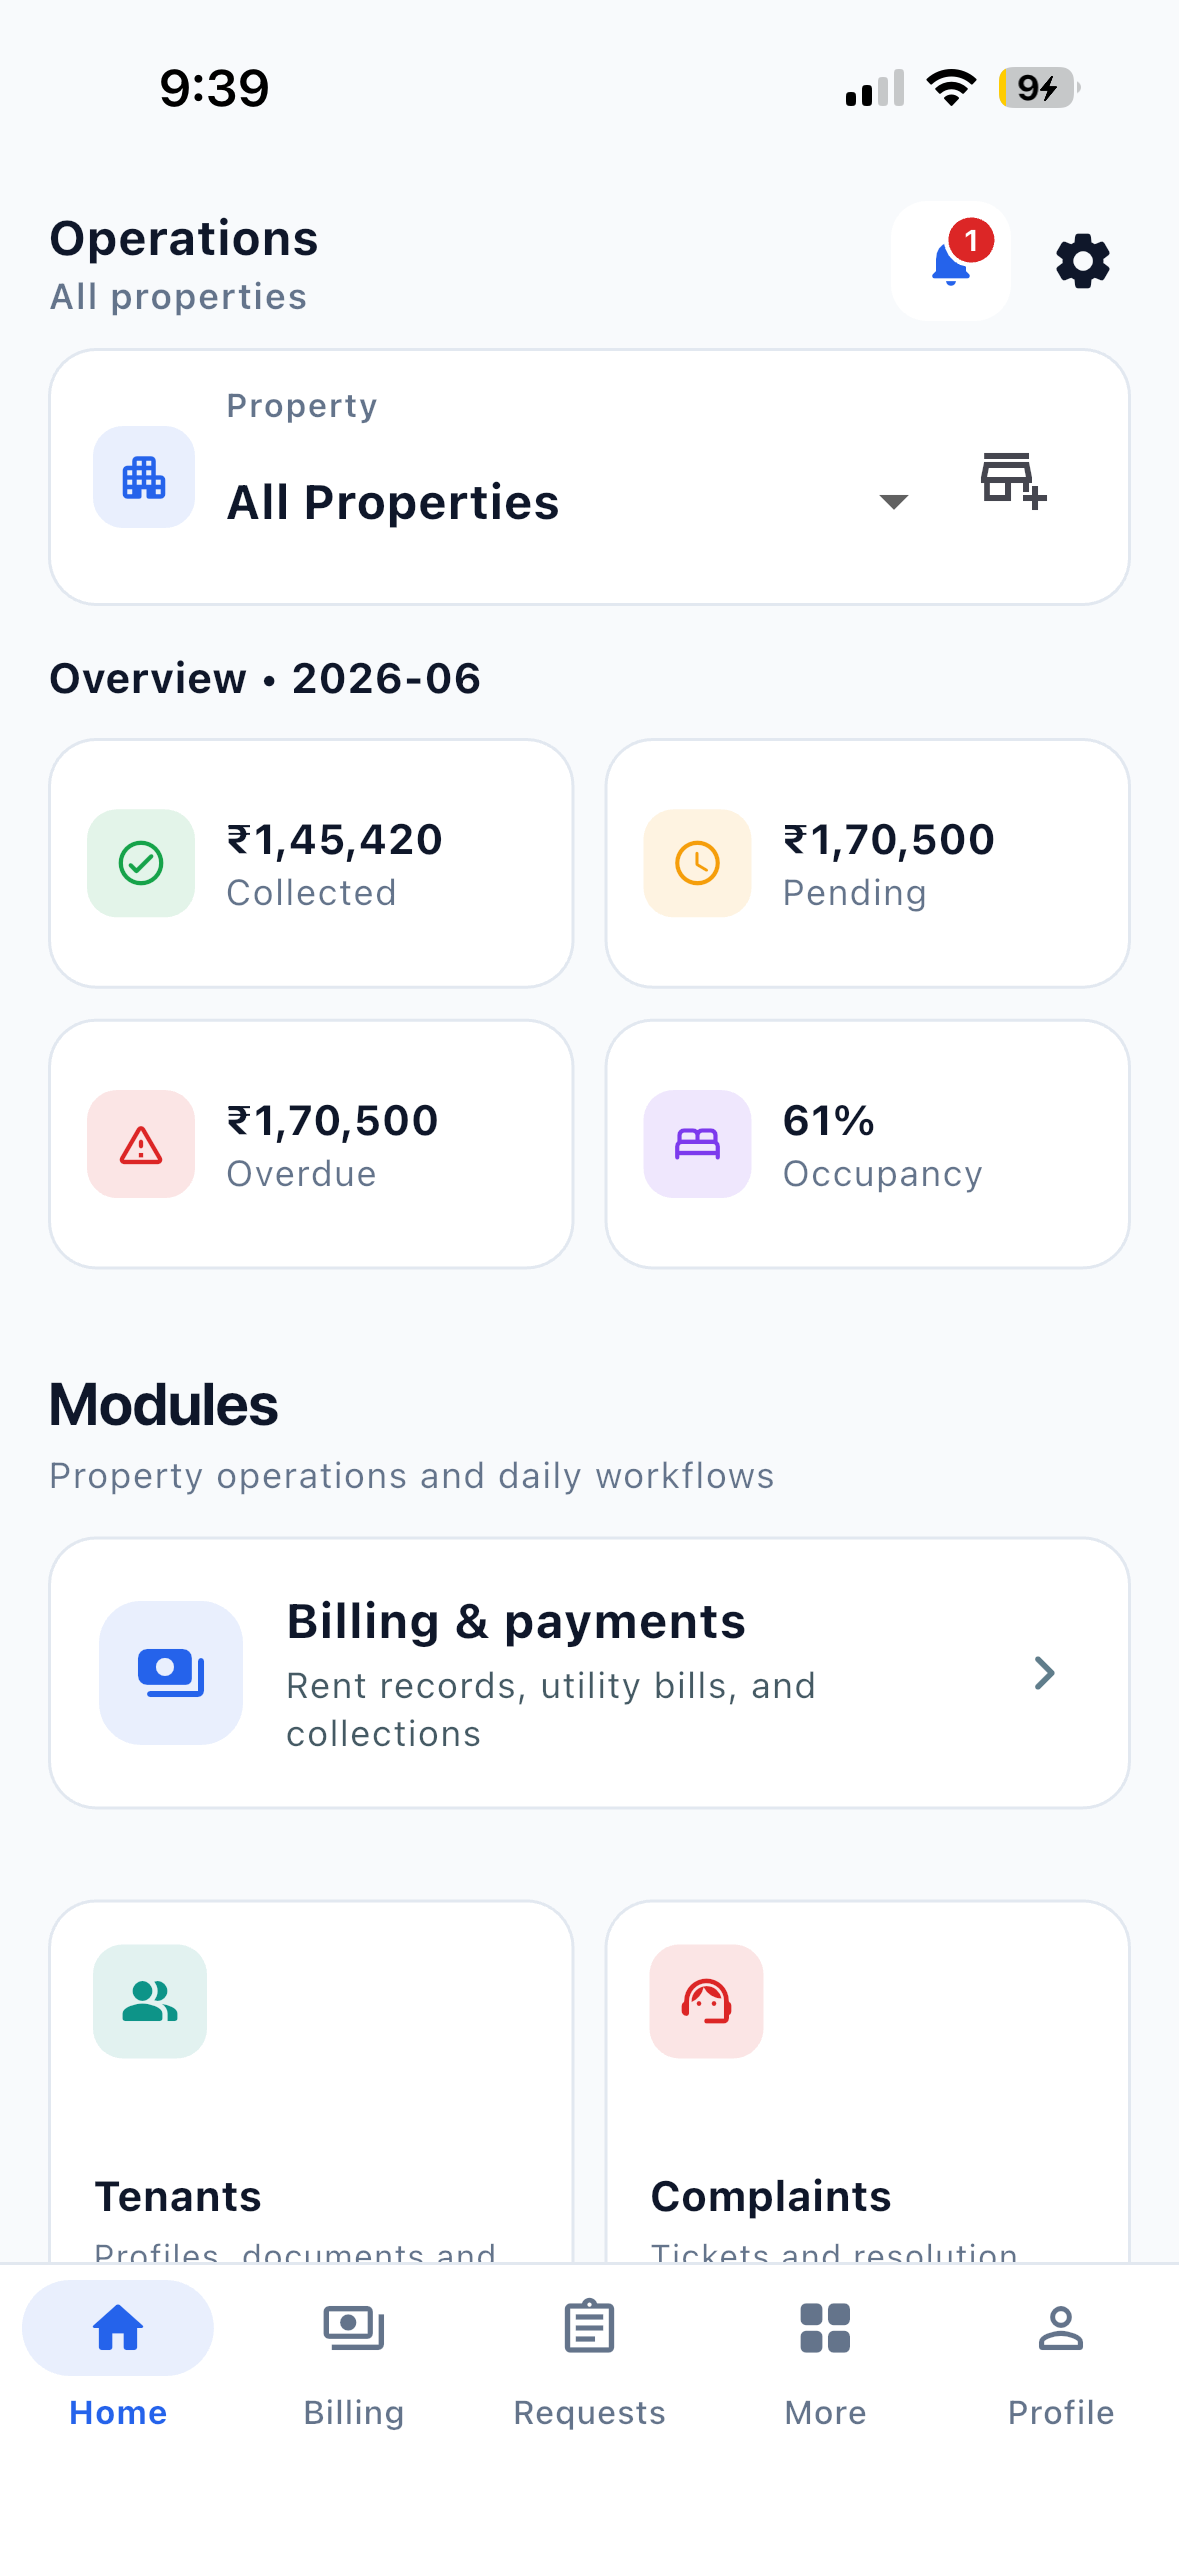
1. Total beds
Your maximum capacity — the ceiling for revenue. Example: Building A has 60 beds, Building B has 40 beds → total capacity: 100 beds.
2. Occupied beds
Beds currently assigned to active tenants. Example: 92 occupied beds out of 100.
3. Vacant beds
Beds available for immediate move-in. Example: 8 vacant beds. These are the beds costing you money today.
4. Occupancy percentage
The single metric that gives you a quick health check:
Occupied beds ÷ Total beds × 100
Example: 92 ÷ 100 × 100 = 92% occupancy. Track this weekly, not monthly.
5. Upcoming vacancies
Tenants who have submitted move-out requests, transfer requests, or are serving notice periods. This is your pipeline of beds about to open — and your window to start filling them before they go empty.
How high-performing PGs reduce vacancy
Start marketing before move-out
The most common mistake: waiting until a tenant leaves before searching for a replacement. High-performing operators track move-out dates, begin outreach immediately, and schedule property visits while the outgoing tenant is still in place.
The goal is zero downtime between tenants — or as close as realistically possible.
Answer availability questions instantly
When a prospect asks “Is a bed available?”, delayed responses lose bookings. They call the next PG on their list. You should know — bed level, floor level, boys or girls wing — within seconds, not after three phone calls.
Review occupancy weekly — not monthly
Month-end reviews are too late. A weekly check surfaces declining trends, upcoming move-outs, and underperforming properties before revenue drops.
- Are vacant beds increasing compared to last week?
- Which property has the lowest occupancy?
- How many move-outs are scheduled in the next 30 days?
- How long has each vacant bed been empty?
Understand why tenants leave
Occupancy is not only about filling beds — retention matters too. Track common move-out reasons:
- Job relocation or graduation
- Price concerns
- Maintenance or complaint issues unresolved
- Roommate conflicts
- Better offer from a competing PG
Patterns reveal operational fixes that improve retention — which is cheaper than constantly marketing empty beds.
Why spreadsheets break at scale
Spreadsheets work for small properties with one person updating them daily. As occupancy grows, problems multiply:
- Multiple versions of the same file on different phones
- Manual updates that lag behind reality
- Formula errors that hide vacant beds
- No real-time view for staff at the gate
- Hours spent maintaining records instead of analysing them
For a deeper look at when spreadsheets stop working, read PG management app vs Excel.
How modern PG operators track occupancy
Instead of separate spreadsheets per property, modern operators use a centralized system that provides:
- Bed-level occupancy — vacant, partial, or fully occupied
- Real-time vacancy visibility for owners and permitted staff
- Move-in, move-out, and transfer records in one place
- Multi-property dashboards from a single account
- Occupancy and tenant reports exportable as Excel or PDF
The shift is simple: spend time improving occupancy, not searching for occupancy data.
Weekly occupancy checklist
Review these metrics every week. If you cannot pull them within a few minutes, your tracking process needs an upgrade:
- Total beds across all properties
- Occupied beds today
- Vacant beds available now
- Occupancy percentage (overall and per property)
- Upcoming move-outs in the next 30 days
- Average days each vacant bed has been empty
- Property-wise occupancy comparison
The five-minute test
Set a timer. Can you answer all seven items above in under five minutes — without calling staff or opening three different files? If not, vacant beds are costing you more than you think.
Final thoughts
Occupancy is the heartbeat of every PG business. Rent collection, utilities, staff salaries — all of it depends on beds being filled.
The most successful operators treat occupancy as a live operational metric, not a month-end calculation buried in a spreadsheet. When bed availability, move-outs, and occupancy percentages are visible in real time, owners make faster decisions, reduce vacancy periods, and protect revenue.
Even a 5% improvement in occupancy — five beds in a 100-bed PG — can add ₹40,000 per month. That is worth building a system for.
For the full operational playbook, see The complete guide to running a PG, hostel or co-living space in India.
EasyAavaas helps PG owners track occupancy at the bed level, manage multiple properties, and maintain clear visibility into vacancies — without relying on spreadsheets or scattered records.
Use one available-bed denominator
For a snapshot, divide occupied beds by beds available for use. Exclude beds closed for repairs from both availability planning and vacancy opportunity. Keep planned departures separate from current occupancy. A room with three residents in four available beds is 75% occupied at bed level, even though the room itself is occupied.
Apply the calculation
Use the existing occupancy calculator, then compare your own monthly cost assumptions in the cash planning calculator. Neither tool predicts bookings or guarantees revenue.