Analytics & dashboards

Analytics & Dashboards for PGs, Hostels and Co-Living Spaces

Track occupancy, rent collection, tenant activity and operational performance across one or multiple properties from a single dashboard.

EasyAavaas provides analytics dashboards with occupancy, rent collection and tenant insights. Whether you run one PG or twenty, your dashboard shows the numbers that matter for daily operations — updated from live property data, not manual spreadsheets.

Practical guide · Live product workflow · Built for India

✓Analytics & dashboardsA practical path
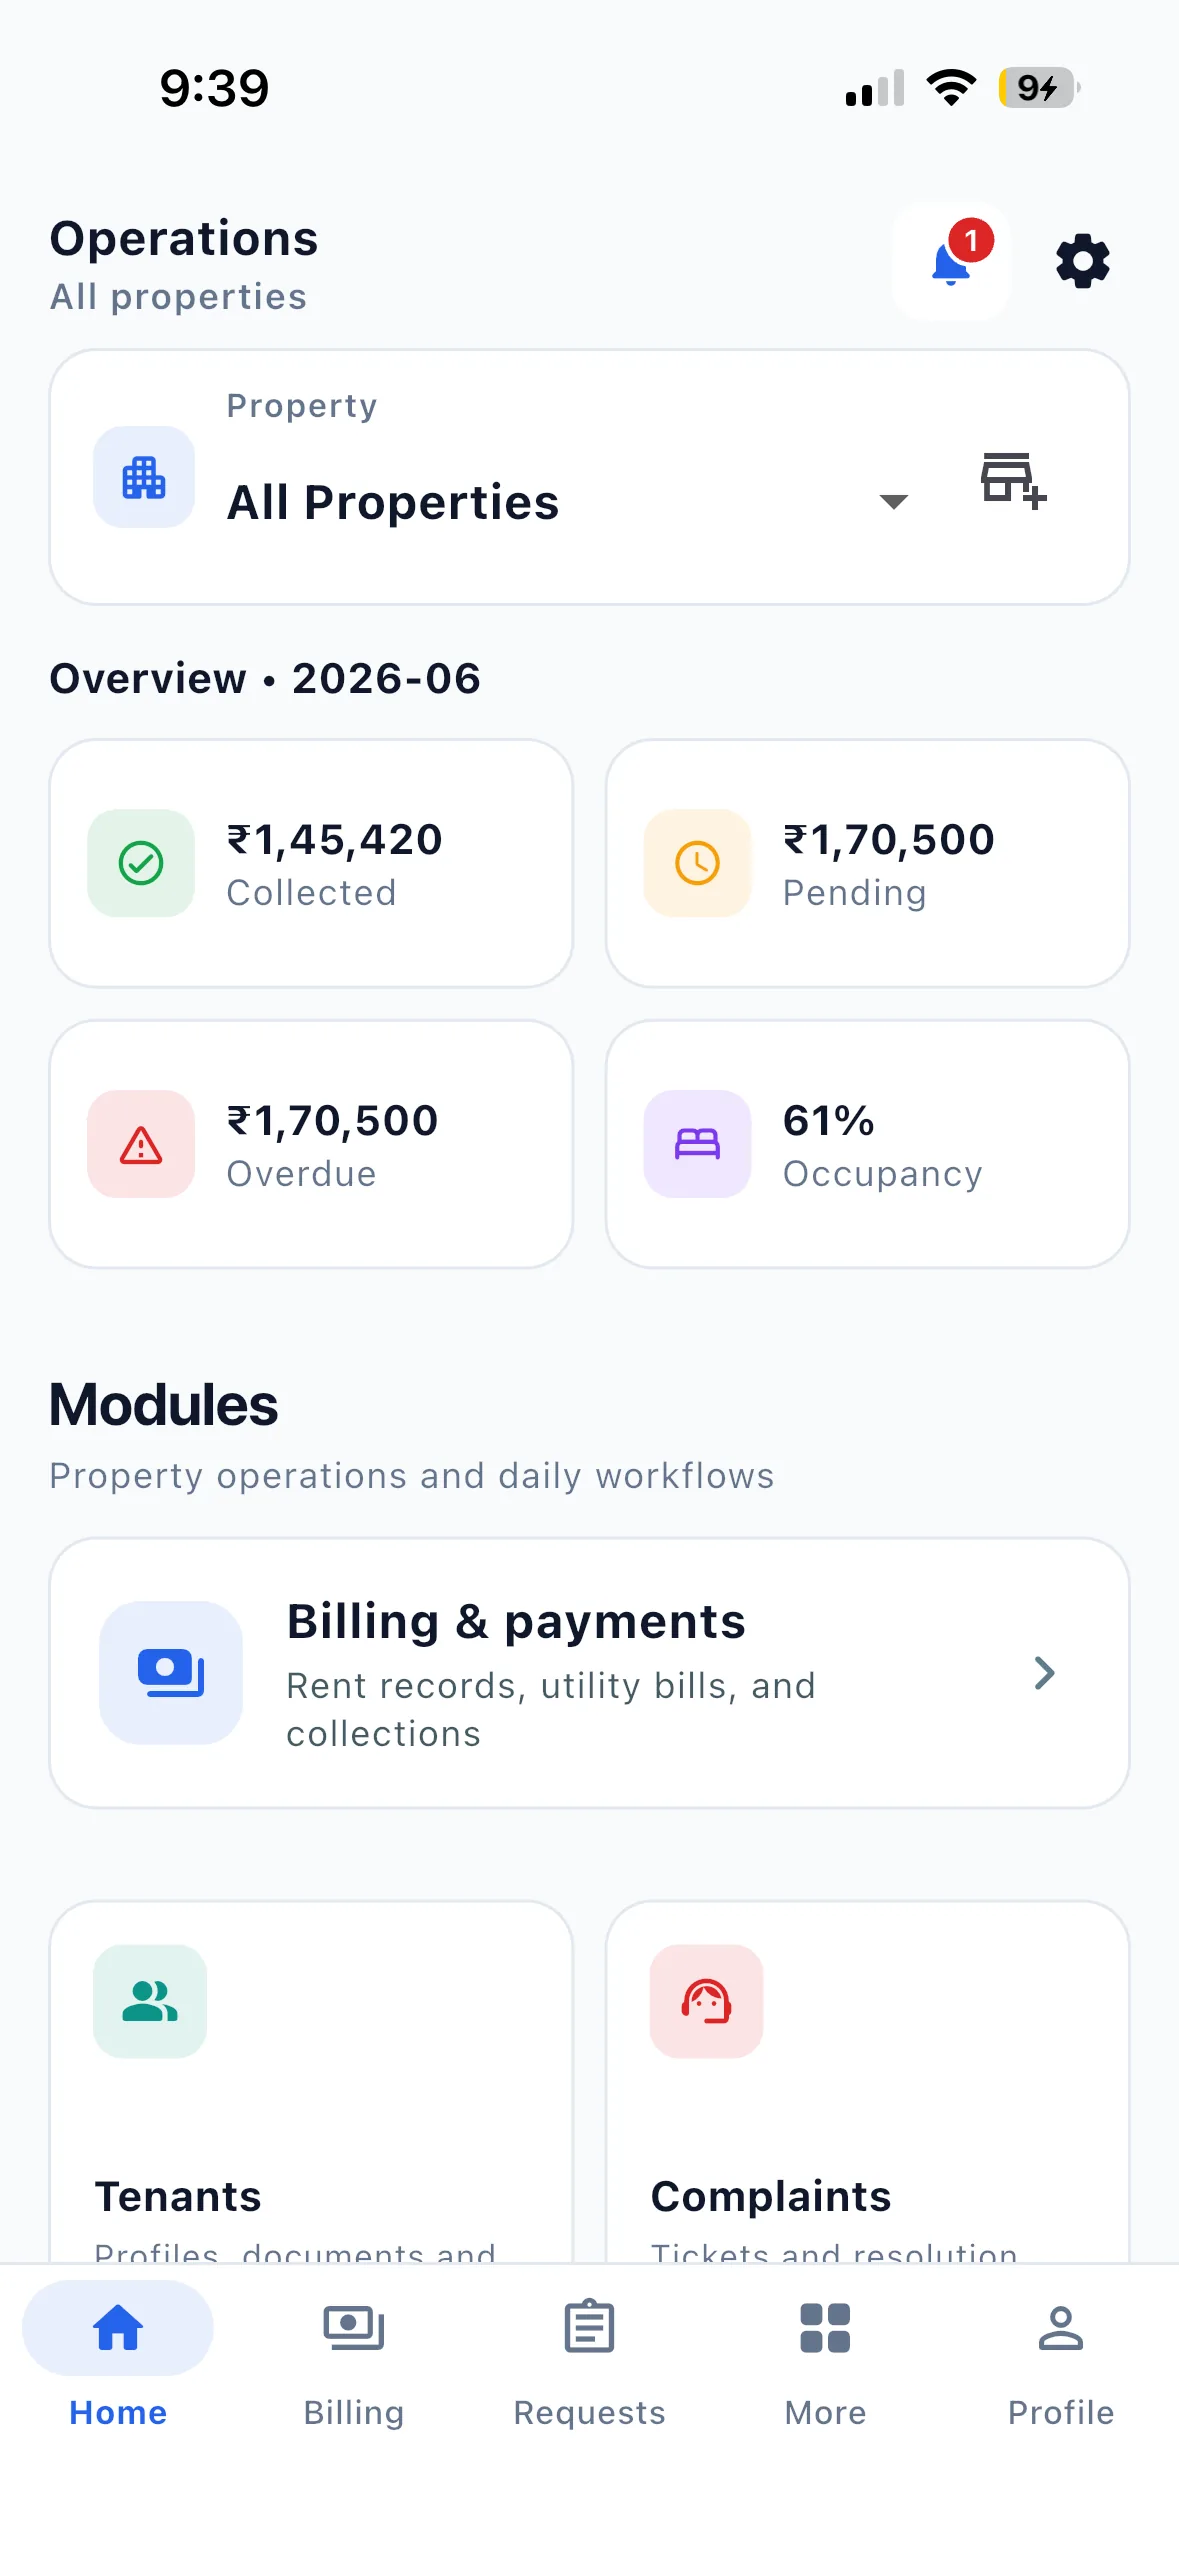
EasyAavaas owner home dashboard on iPhone
EasyAavaas guideWhat to do, when to do it, and why
01

Occupancy Analytics

Know exactly how full your PG is — down to every bed and room. The dashboard breaks down occupancy by property and shows:

Stop guessing availability before walk-ins. Open the dashboard and see which beds are free right now.

  • Total rooms and room status: vacant, partially occupied, fully occupied, under maintenance
  • Total beds with vacant vs occupied counts
  • Occupancy rate percentage calculated automatically (0–100%, rounded)
  • Per-property breakdown when managing multiple PGs
MetricDescription
Total RoomsAll rooms across the property
Vacant RoomsRooms with no occupants
Partially Occupied RoomsRooms with some beds filled
Fully Occupied RoomsAll beds in room are taken
Under Maintenance RoomsTemporarily unavailable
Total BedsAll beds in the property
Vacant BedsAvailable for assignment
Occupied BedsCurrently assigned to tenants
Occupancy Rate %Occupied beds ÷ total beds × 100
02

Rent Collection Analytics

Rent is the heartbeat of your PG business. EasyAavaas tracks every rupee — billed, collected, pending, and overdue — for any billing month you select.

What you see on the dashboard:

  • Collected amount — total rent received for the selected month
  • Pending amount — outstanding balance on pending and partially paid records
  • Overdue amount — outstanding balance on overdue records specifically
  • Total billed amount — sum of all rent generated for the month
  • Paid count — number of tenants fully paid
  • Pending count — number of tenants with outstanding balance (not yet overdue)
  • Overdue count — number of tenants past due date

Rent Ledger Report (exportable)

For detailed analysis, export the Rent Ledger report. It includes:

  • Every rent record with tenant name, room, and phone
  • Payment history: payer, collector, amount, method, UTR, verification status
  • Utility charges linked to each rent record
  • Collection rate percentage
  • Breakdown by status: Pending, Partially Paid, Paid, Overdue, Waived, Cancelled
03

Tenant Analytics

Understand your tenant base at a glance — who is active, who is joining, and who is leaving.

Use this for owner reviews, accountant handoffs, or compliance records.

MetricDescription
ActiveTenants currently living at the property
PendingTenants enrolled but not yet fully active
Moving OutTenants with move-out requested or in progress
TotalAll tenant profiles on record

Tenant Directory Report (exportable)

Export a full tenant directory with:

  • Name on record and phone number
  • Room and bed assignment
  • Monthly rent amount
  • Move-in date
  • Security deposit amount and status
  • Tenant status
04

Operational Metrics

Analytics are not just about money and beds — they show work waiting for your team. The operations panel tracks items that need action today:

These counters help wardens prioritize their day. A rising pending payment count means rent follow-ups are needed. Pending requests mean approvals are bottlenecked.

The dashboard also tracks announcement volume — total announcements sent and count in the last 30 days — so you know how actively you are communicating with tenants.

MetricDescription
Active MembersStaff and team members currently assigned to the property
Pending RequestsApproval requests awaiting decision (room change, move-out, visitor entry, maintenance, and more)
Pending Payment VerificationsTenant-submitted payment proofs waiting for staff verify/reject
05

Multi-Property Rollups

EasyAavaas supports multi-property management for PGs, hostels and co-living operators — and the dashboard reflects that.

When you manage multiple properties:

  • Portfolio totals — combined rent, occupancy, tenant, and operations stats across all properties you can access
  • Per-property cards — each PG shown individually with its own metrics
  • Property filter — narrow any dashboard view to a single property using ?propertyId=
  • Property count — dashboard shows how many properties are included in the rollup

Example use cases

  • Owner with 5 PGs in Bangalore: morning check of total overdue rent across all locations
  • Warden at one PG: filter dashboard to their property only
  • Accountant: export rent ledger per property for monthly reconciliation
06

PDF & Excel Exports

Dashboards show live numbers. Reports give you shareable documents for owners, accountants, and compliance.

EasyAavaas includes three exportable report types, available in PDF and Excel formats:

1. Property Summary

Overview of occupancy, tenant status, and rent collection for the selected billing month.

  • Occupancy stats (rooms, beds, occupancy rate %)
  • Tenant stats (active, pending, moving out, total)
  • Rent stats (collected, pending, overdue, total billed)
  • Collection rate percentage and outstanding amount highlights

2. Rent Ledger

Detailed rent records with full payment history.

  • Tenant name, phone, room number
  • Rent amount, paid amount, remaining balance
  • Status and overdue days
  • Utility charges per record
  • Every payment: payer, collector, amount, method, UTR, date, verification status

3. Tenant Directory

Active tenants with assignments and financial snapshot.

  • Name on record and phone
  • Room and bed label
  • Monthly rent
  • Move-in date
  • Security deposit amount and status
  • Tenant status

Frequently asked questions

Common questions about analytics & dashboards with EasyAavaas.

Can I view analytics for just one property?

Yes. Filter the dashboard by property to see stats for a single PG, or view combined totals across all your properties.

Can I export reports for my accountant?

Yes. Property Summary, Rent Ledger, and Tenant Directory reports export as PDF or Excel.

How often does the dashboard update?

Dashboard stats are computed from live property data on each request — rent payments, bed assignments, and tenant changes reflect immediately.

Watch the walkthroughs

Short videos from our YouTube channel showing these workflows in the live app.

EasyAavaas Hindi Demo — PG Management with the App & WhatsApp

A Hindi walkthrough of daily PG operations with EasyAavaas and WhatsApp: rent records, payment proof and reminders, tenant documents, utility bills, complaints, visitors, notices, team permissions and reports. Rent money goes directly to you; the app keeps the records.

Some screens and messages are reconstructed with example data. Notifications depend on the relevant settings and an available WhatsApp contact.

All tutorials on YouTube

Related solutions

Explore other operational modules — or combine them on one platform.

Bring the team together

See Your Numbers in Real Time

Stop running your PG on gut feel and WhatsApp screenshots. EasyAavaas gives you live dashboards and exportable reports built for how PGs actually operate. No credit card required. Set up your first property in minutes.